WiFi Temperature Sensor
GitHub Project: https://github.com/atkaper/ESP8266_DS18B20_WiFi_Temperature_Sensor
Introduction
Last Tuesday (the 5th of may) was a good day for a small project… I have some computer equipment running in the fuse-box cupboard, and it gets really warm in there. Especially during summer time. So I thought it would be nice to monitor the actual temperature in that cupboard (a.k.a. “server room”), to determine when all of that stuff is going to fail.
For this, I needed the massive number of components equal to 2. I thought 3, but 2 seemed enough in the end.
The intelligent part is an ESP8266 (WeMos D1 mini – clone), and the temperature sensor to use is the DS18B20. The DS18B20 is a digital three legged component, with a ground, a power (5V) and an I/O pin.
The ESP8266 WiFi Micro-controller can talk to the DS18B20, and query it’s serial number, and the measured temperature (at a nice accuracy of ±0.5 degrees), and it is calibrated at the factory already.
The first Micro-controller project made by many people is the flashing led project, a.k.a. the Hello-World among Micro-controller. This temperature sensor project might be the number two on the list. It has been described on many many blog posts. So feel free to refer to any of those for more in depth details 😉
Version 1
So how do we connect the parts together? Let’s start with my first attempt;

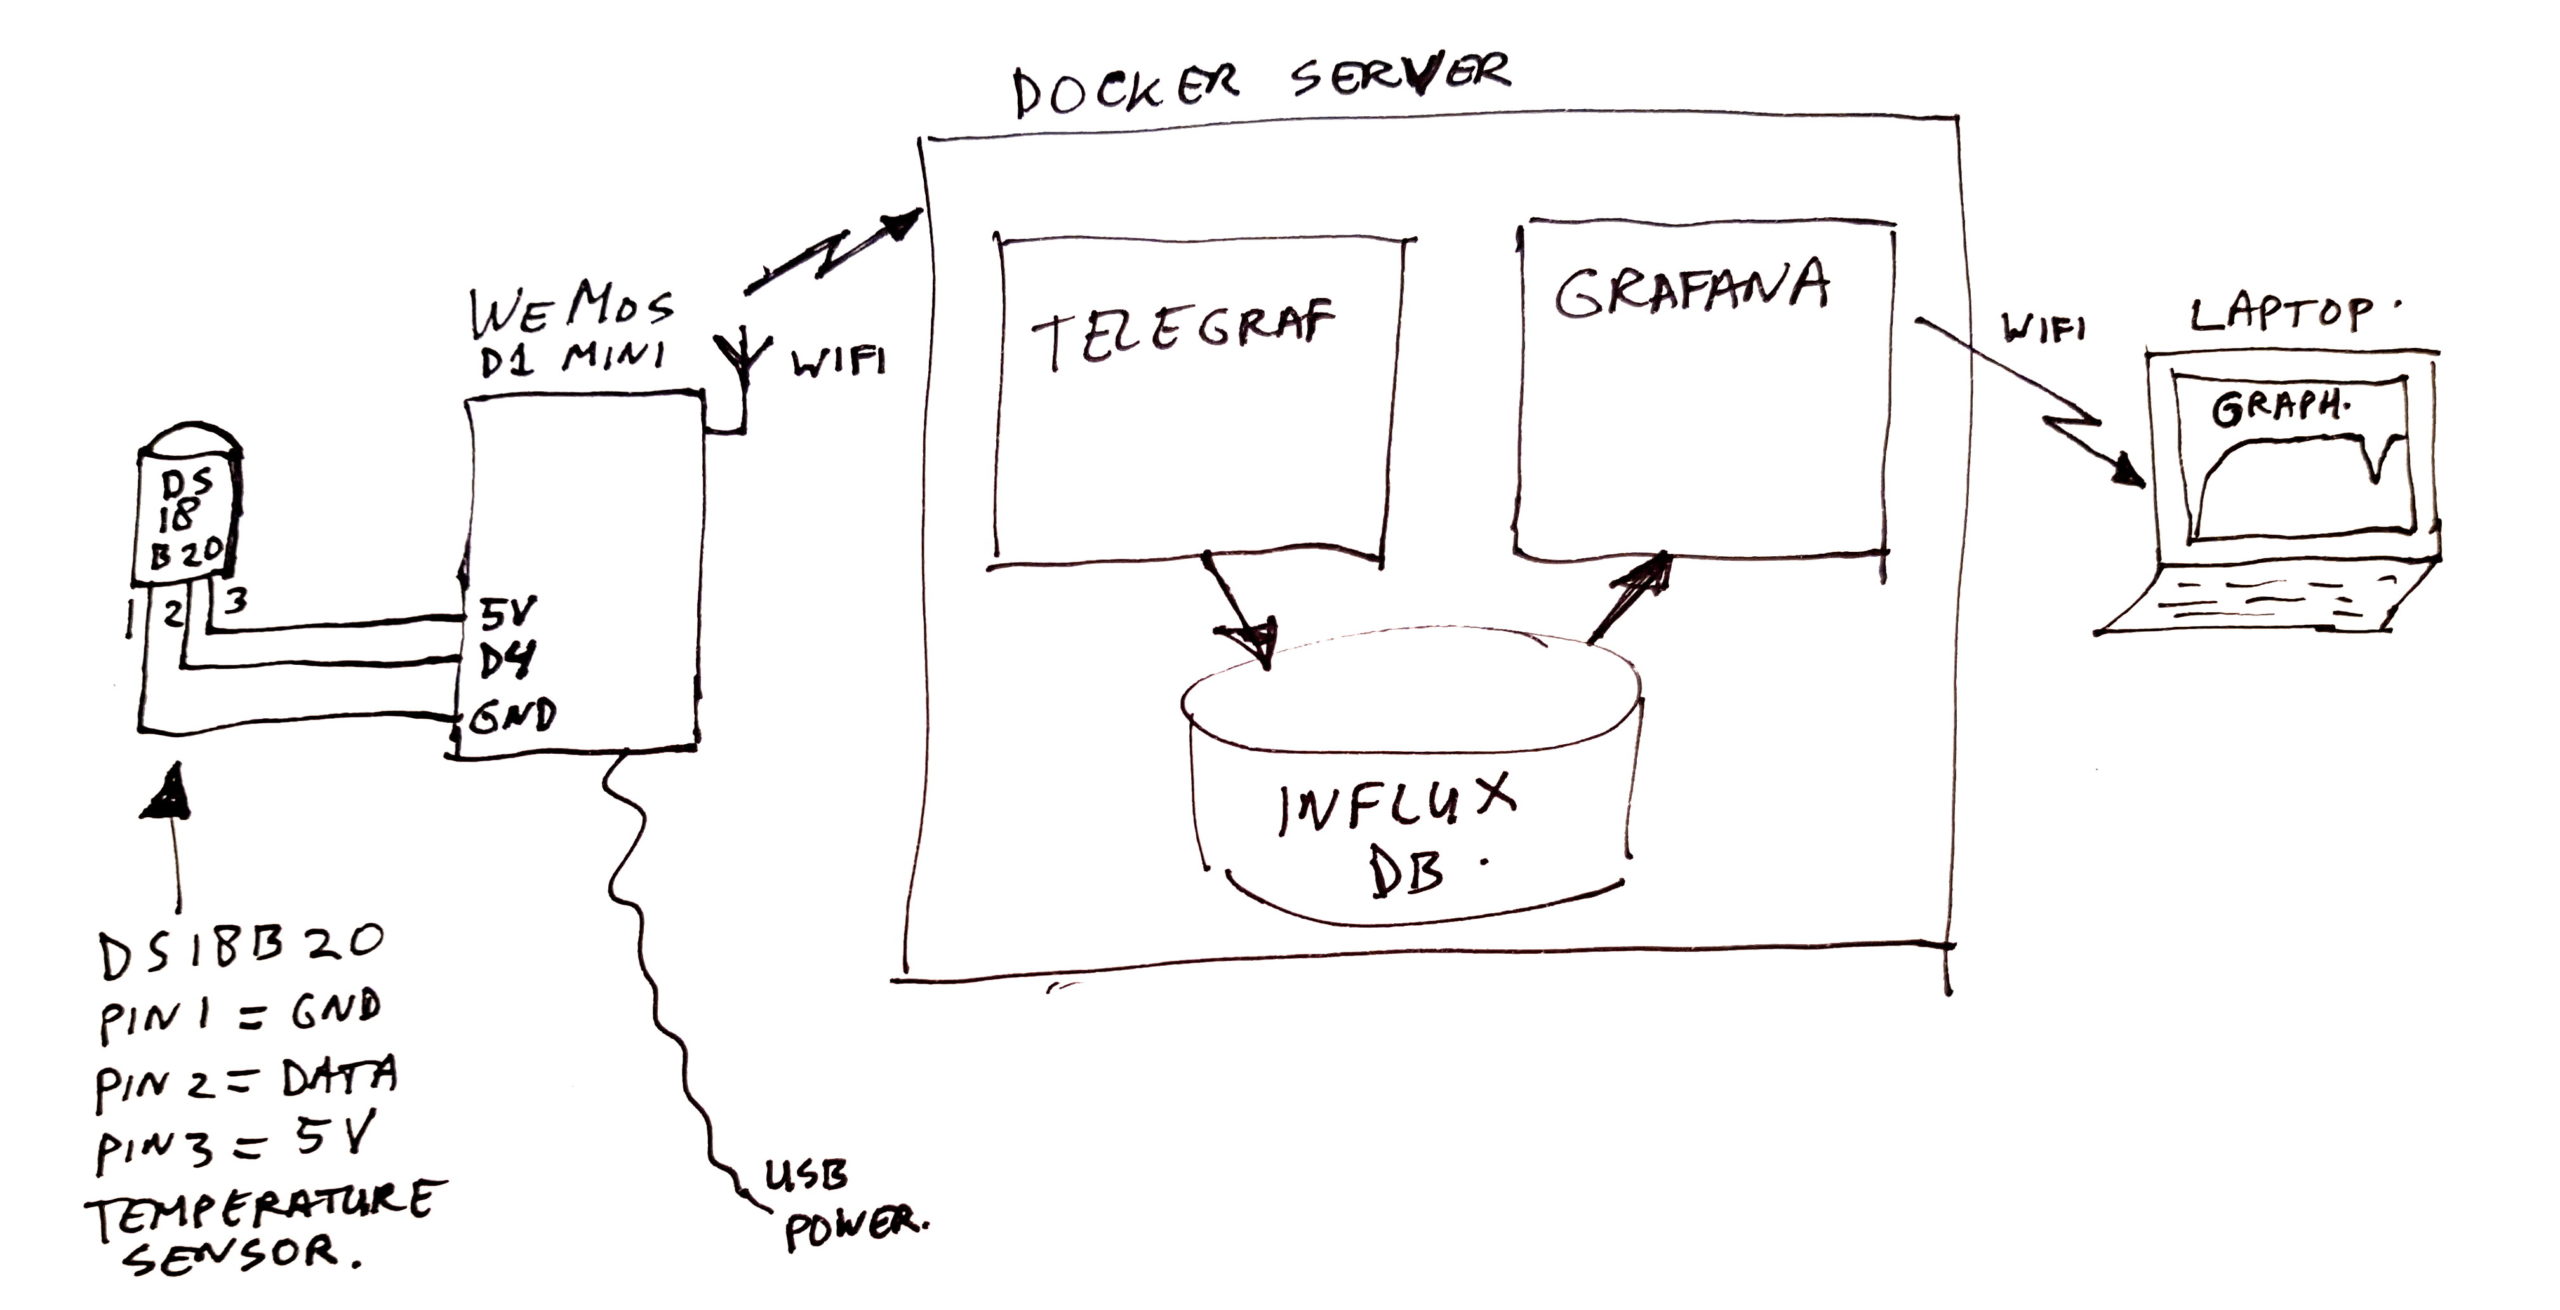
In case it is not visible from the images; if you have the DS18B20 flat side facing towards you, and the legs pointing down, then you count / name the pins from left to right as follows: (1/left) = Ground, (2/middle) = Data, (3/right) = 5 Volts power.
In the photo’s, you can see that pin 1 is connected to pin “G” (ground) of the WeMos, pin 2 is connected to pin “D4” (data 4) of the WeMos, and pin 3 is connected to pin “5V” (power) of the WeMos.
Also in the image, a resistor is shown. It’s a 4.7 Kilo Ohm resistor, connected between 5V and D4, served as pull-up resistor.
Easy peasy you would say – program the WeMos, and be done with it…
Nope, too bad. The WeMos did not recognize my DS18B20. No temperature readings came out of it.
So to find out if it was due to a broken component, I took the next WeMos from the stockpile, a new DS18B20, and another resistor.
No luck either. Then I thought, perhaps my ESP8266 controller on the WeMos does not like mixing 3.3V and 5V. The ESP runs on 3.3V, but uses 5V external power, which is lowered to 3.3V to be fed to the ESP8266. So al input / outputs normally use 3.3V signal levels. So I tried connecting it to 3.3V instead of 5V… Drum roll… Nope. No data.
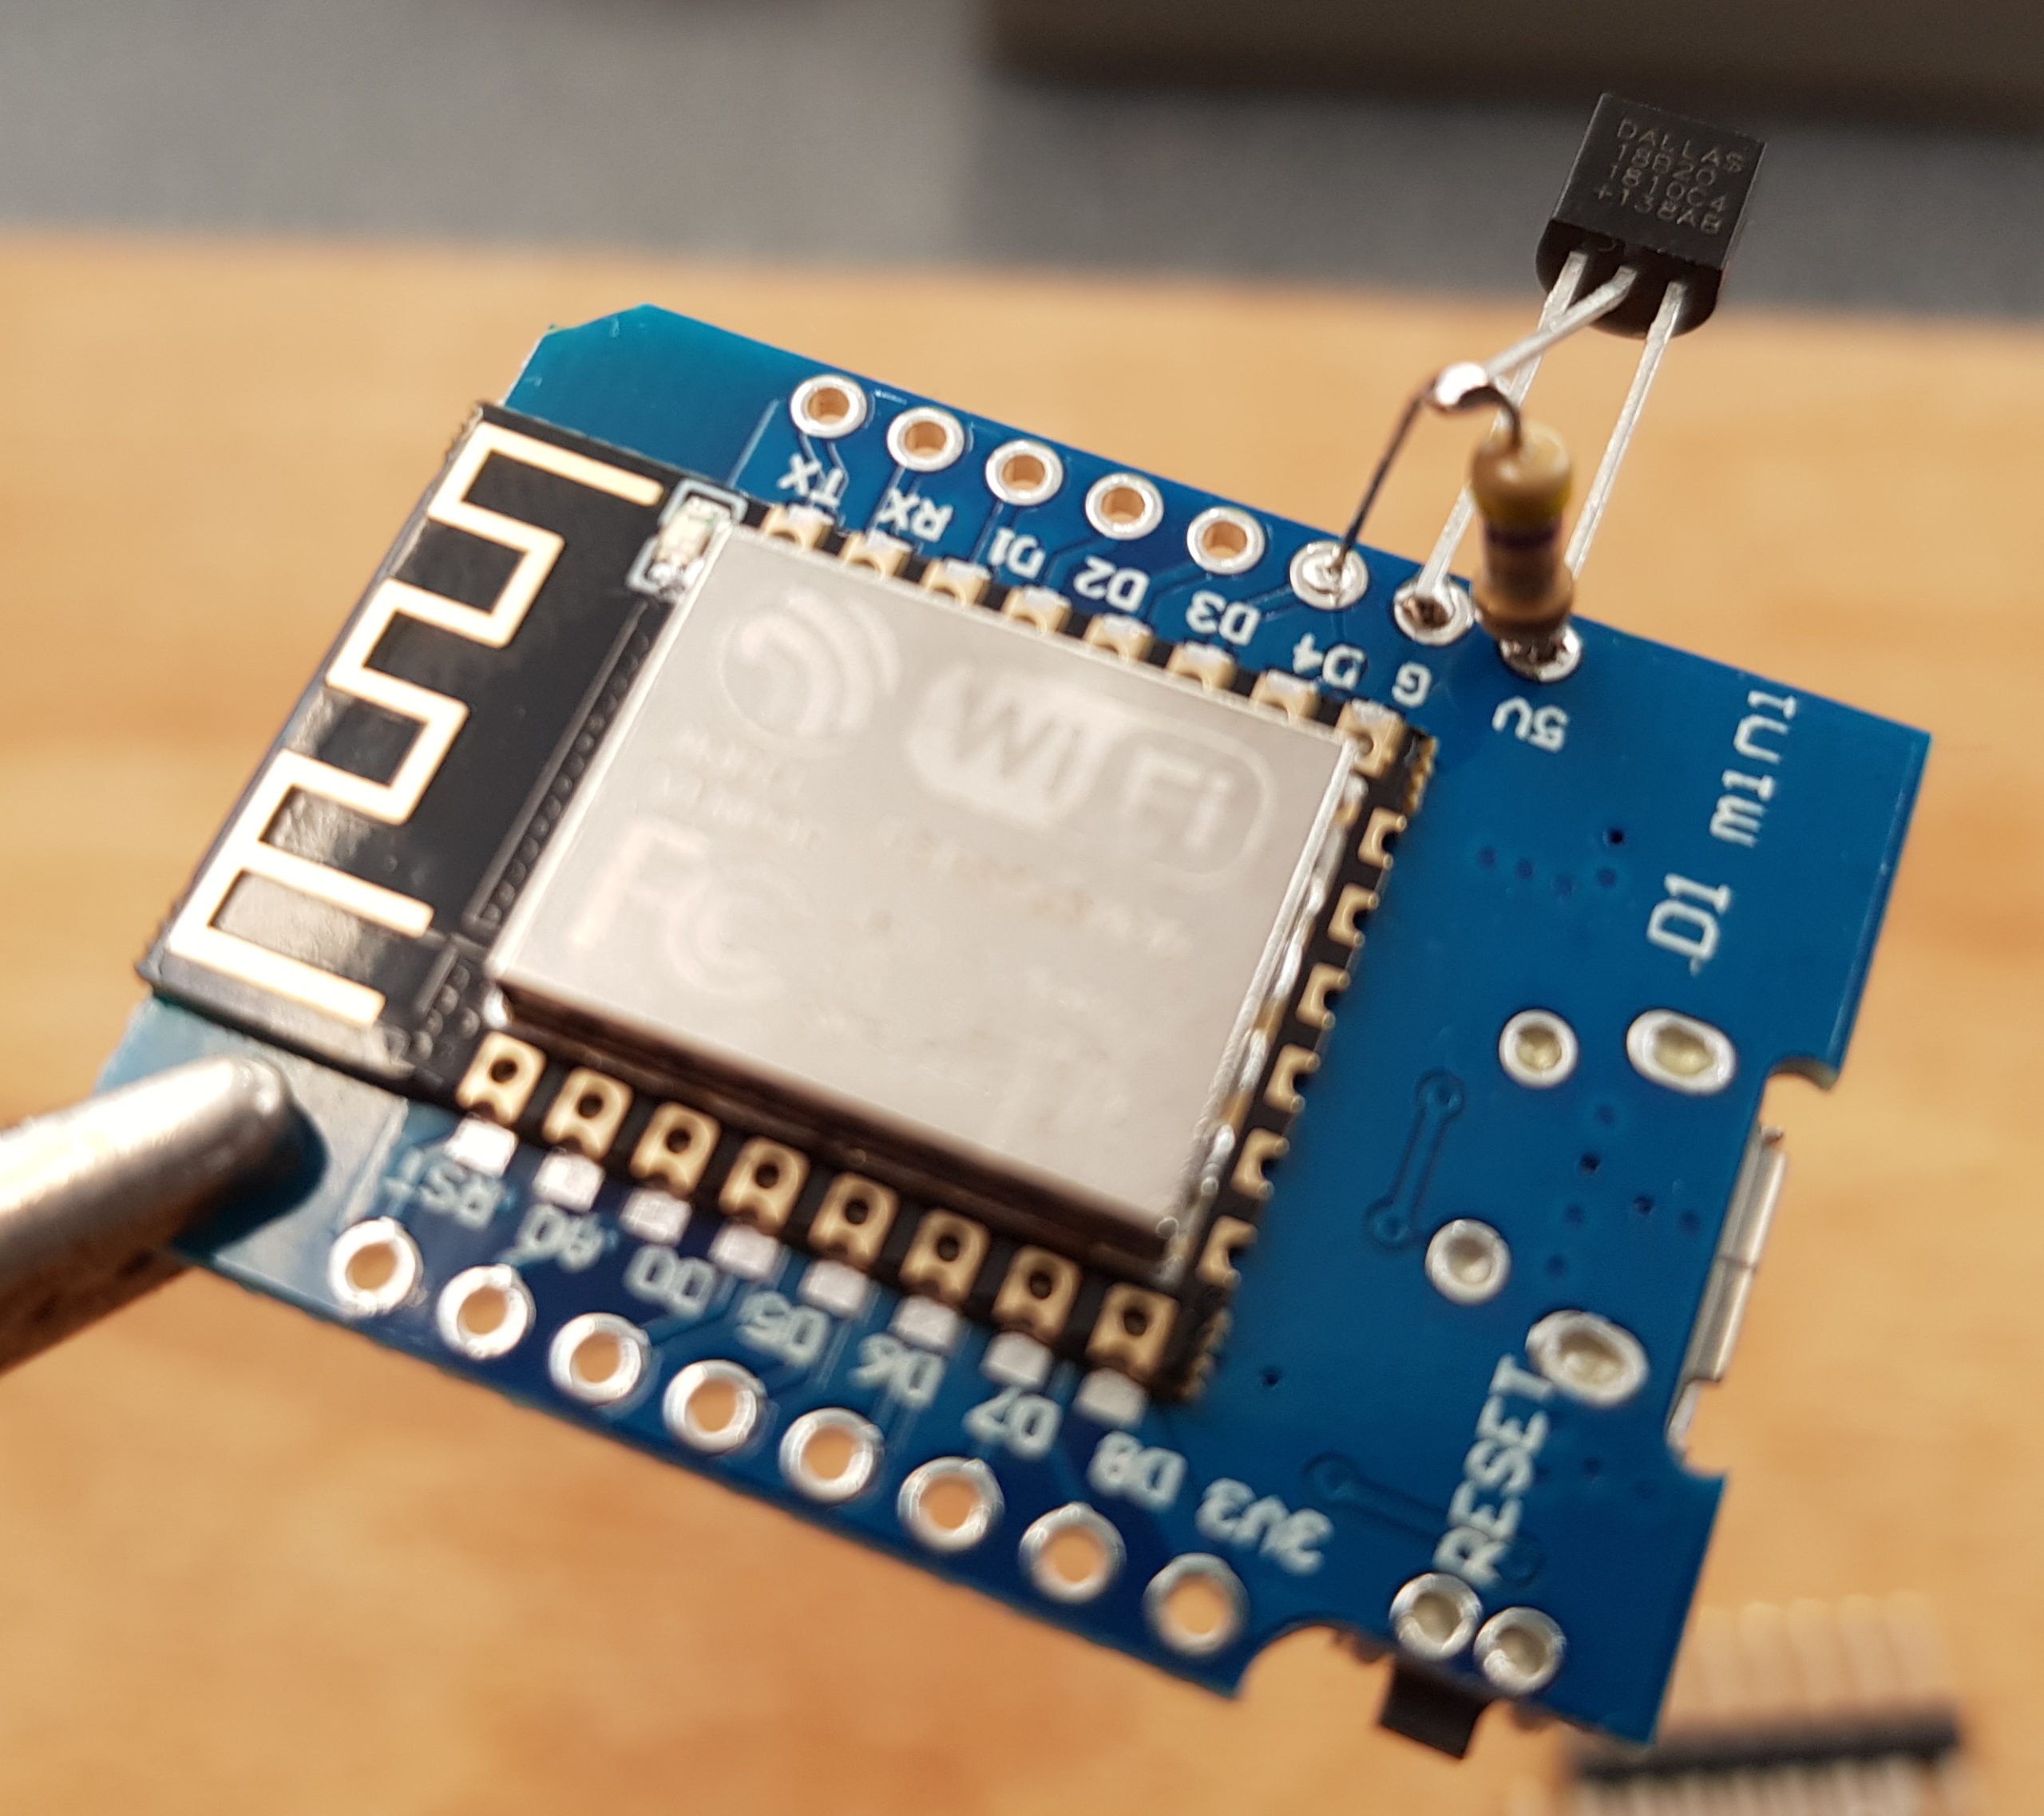
Next attempt, just sticking a DS18B20 in the WeMos holes, this time pin 3 put in D3 next to D4, and change code to set D3 as high output to get 3.3V from it. I did not bother to connect the resistor this time. And YES… I got data! That’s odd, everywhere on the internet, on all blogs and datasheets, it mentions that you must use a pull-up resistor.
So I went back to my first attempt board, and cut off the resistor at the 5V line, and left the rest as is. And yes, also data read from that one. Some progress!
However, the data I got was not really what I expected. The temperature was something like 9 degrees too high. That’s not within the 0.5 accuracy limits, not even close.
Using the 3.3V version even had bigger deviations.
Version 2
So on to my final attempt, which we will call V2, as the in between version has not been photographed:

In this version, I added some wire between the WeMos and the sensor. Let’s say about 15 to 20 cm. I covered the bare pins of the DS18B20 with heat shrink tubing (the stuff which shrinks 50% when heated), and also used some of that to bundle the 3 wires.
And yes, finally I got where I wanted. The temperature measurement was correct now. It seems the WeMos is giving off quite some heat, adding 9 degrees to the measurement when connecting the sensor direct on the board.
The ESP Software
No results without software. See GitHub Project: https://github.com/atkaper/ESP8266_DS18B20_WiFi_Temperature_Sensor for the code. Build and upload using Arduino IDE with ESP board additions configured. Note(s) to self; remember to set memory to have half of it as SPIFFS, for OTA to work. And remember that OTA only works after powering off the device once, and in my case I also need to be on the same access point.
I started off with a standard OneWire DS18*20 example program, as was available in Arduino IDE. The only change was setting it to use pin D4. Results were sent to the serial console.
But I’m not using an ESP8266 / WeMos to get serial data (although, why not? It’s a cheap Micro-controller, which has both USB and WiFi, so you can use USB if you want). But in my case, I was interested in using WiFi, to keep the whole circuit portable. So I amended the standard example, and copy/pasted some web-server lines from other pieces of code. A simple hard-coded SSID network setup. And also added the OTA firmware update option, to allow to upgrade the code without the need of connecting the device to my laptop.
Now it nicely responds with the temperature when querying the root page (/) via a HTTP get.
The code does contain some comments, so should be readable.
Turning data into a graph
Getting some single numeric data measurements is good. Now let’s put it in a graph to be able to look at historic data, with ups and downs. That’s even better.
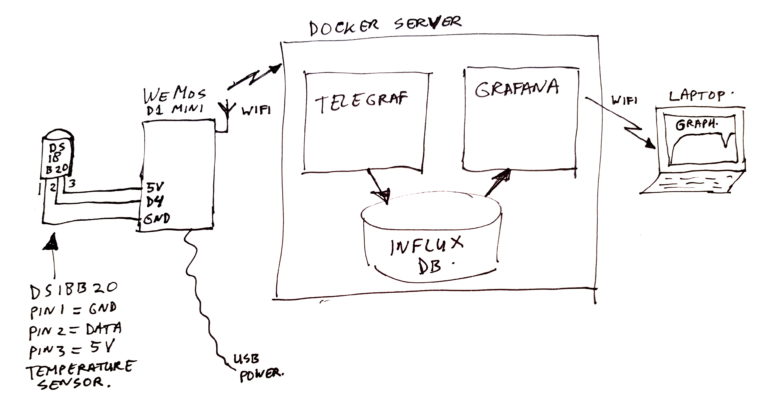
On my NAS server, I have docker running, and I already installed the needed software components earlier, for another project. I am using an Influx time-series database, with the Telegraf statistics “poller” to read my data, and I use Grafana to turn the data from the Influx database into a nice graph. See the notes at the end of this document for links to the needed docker images.
I won’t go into detail on how to setup these three components, but will show a couple of configuration snippets, which I used to show this new temperature graph.
In Telegraf I created a little shell script, which executes a “curl” command to read the temperature sensor, and format it in a way which is parse-able for Telegraf. The script is called “get-fuse-box-temp.sh“, and lives in a scripts folder;
#!/bin/bash

echo -n "fusebox_temperature degrees_c="
curl -s http://192.168.0.57/
(If you want to replicate this project, make sure to alter the IP address in the above script to match the one of your WeMos device! I Recommend using a fixed IP in your DHCP server, that’s what I did).
To get Telegraf to execute this script, and store the data in it’s data-store, add the next section in the telegraf.conf file:
[[inputs.exec]]
  commands = [ "/etc/telegraf/scripts/get-fuse-box-temp.sh" ]
  data_format = "influx"
And finally in Grafana, set up a data-source which points to Influx, and make a new graph with a query like this:
SELECT mean("degrees_c") FROM "fusebox_temperature" WHERE "host" =~ /^$host$/ AND $timeFilter GROUP BY time($interval) fill(null)
The $host and $interval variables come from two drop-down select boxes on the graph page. I actually just downloaded a standard graph page for all default telegraf system metrics, and just copy/paste one of the graphs and altered the query on it to use my new counters.
And here is the final result:
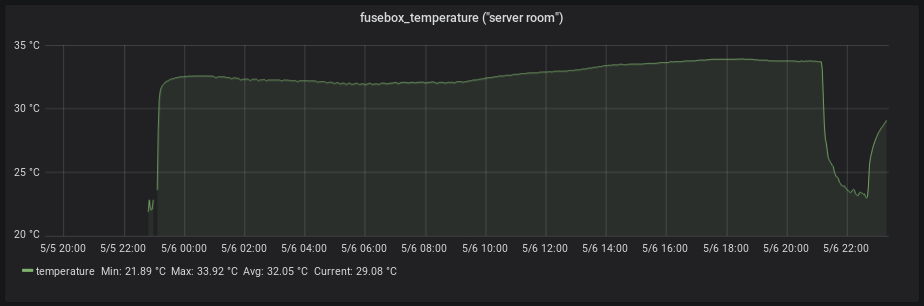
The graph started with a room temperature of 21 degrees, as the device was in the living room at that time. Then I moved it into the fuse-box cupboard, and the temperature went up to 33 degrees. The dip at the end was when someone opened the cupboard door for a while.
Closing Thoughts
Instead of building your own software, you can also use Tasmota. That’s a nice open-source project, which supports lots of devices running an ESP8266. It has a nice WiFi manager, which allows you to set up the network dynamically, has MQTT, and other transport protocols, and has lots of configuration options. A great piece of software! But I like to do some coding, so I went for my own custom firmware. I have used Tasmota for some WiFi on/off switches.
I think in future I might build some more of these WiFi Temperature sensors. To measure living room temperature, and for example the input and output temperature of the Air-co, and perhaps the floor heating system. Not as critical as monitoring the “server room”, but always nice to get a grip on energy consumption when heating or cooling the house.
It is by the way quite simple to add more than one sensor to the WeMos. You can simply connect a whole bunch of them in parallel. The software (with some small changes, or just use Tasmota) will be able to read them one-by-one. I can imagine that Air-co measurement can be done using two DS18B20’s on a single WeMos (one on the cool side, one on the warm side), and floor central heating incoming and outgoing pipe temperature in the same way.
Al in all, this was a nice little project, with some unexpected surprises. And nice to see that adding a graph was not too hard also. In the past I would have needed to add my own database and website code to render those graphs. Grafana + Influx + Telegraf make this much easier.
Thijs Kaper, 8th of May, 2020.
References
- https://hub.docker.com/_/influxdb (the InfluxDb docker image)
- https://hub.docker.com/_/telegraf (the Telegraf docker image)
- https://hub.docker.com/r/grafana/grafana/ (the Grafana docker image)
- https://grafana.com/grafana/dashboards/1443 (the default Telegraf Host Metrics dashboard)
Bonus
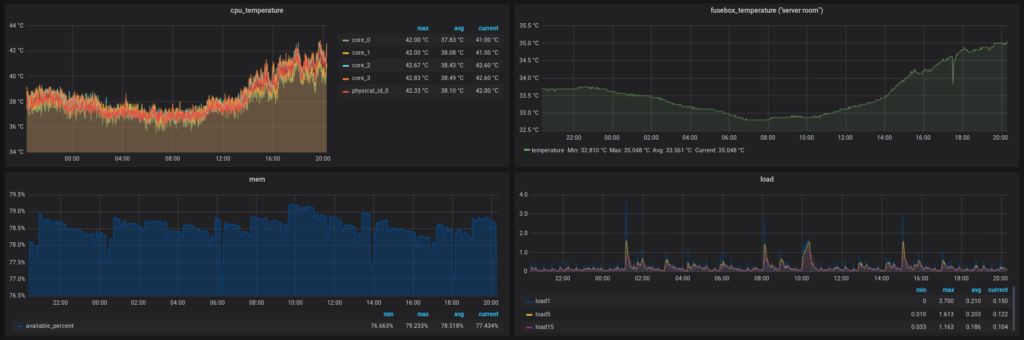
As a bonus, my get-cpu-temp.sh script, which measures my CPU core temperatures in my NAS (the top left graph in above image);
#!/bin/bash

echo -n "cpu_temperature "

for i in 1 2 3 4 5
do

  echo -n "`cat /sys/devices/platform/coretemp.0/hwmon/hwmon0/temp${i}_label | tr '[:upper:]' '[:lower:]' | sed -r \"s/\s+/_/g\"`=`cat /sys/devices/platform/coretemp.0/hwmon/hwmon0/temp${i}_input`"
  if [ "$i" != "5" ]
  then
     echo -n ","
  fi

done
echo
To run this script next to the other measurement script, the telegraf.conf config section would be:
[[inputs.exec]]
  commands = [ "/etc/telegraf/scripts/get-cpu-temp.sh", "/etc/telegraf/scripts/get-fuse-box-temp.sh" ]
  data_format = "influx"
And the Grafana query for it (repeat 5 times, using the names of the core measurements; core_0, core_1, core_2, core_3, physical_id_0);
SELECT mean("core_0")/1000 FROM "cpu_temperature" WHERE "host" =~ /^$host$/ AND $timeFilter GROUP BY time($interval) fill(null)
Oh, and another tip when you install Telegraf in a docker container; Use the “--hostname=telegraf” docker run option, to give that container internally a fixed hostname. If you do not do that, it gets a random name assigned, and that hostname will end up in your counters, which then get messed up after each restart.