P1 Energy Meter Reader using Python in Docker
Updated script (October 30, 2020) to also write to influxdb. See GitHub. Important note/correction: I just found out (November 1, 2020) that when using the METER_VIEW, you have to multiply the values by 4, if you measure every 15 minutes, to get to the proper WH and GAS_M3 values 😉
Summary
A python script, running in a docker container, to read energy consumption and back delivery data from the digital “smart?” meter (as is installed in many homes in the Netherlands). Storing it in mysql and/or influxdb for further use.
GitHub Project: https://github.com/atkaper/p1-energy-meter-reader-using-python-in-docker
Backstory
Somewhere in 2018, my old analog / mechanical energy meter broke down, and got replaced by a new digital one. The counters of these new ones are read remotely using an internal GSM connection. But… you also get a local serial port, called the P1 port, which allows the home owner to read the energy consumption data also.
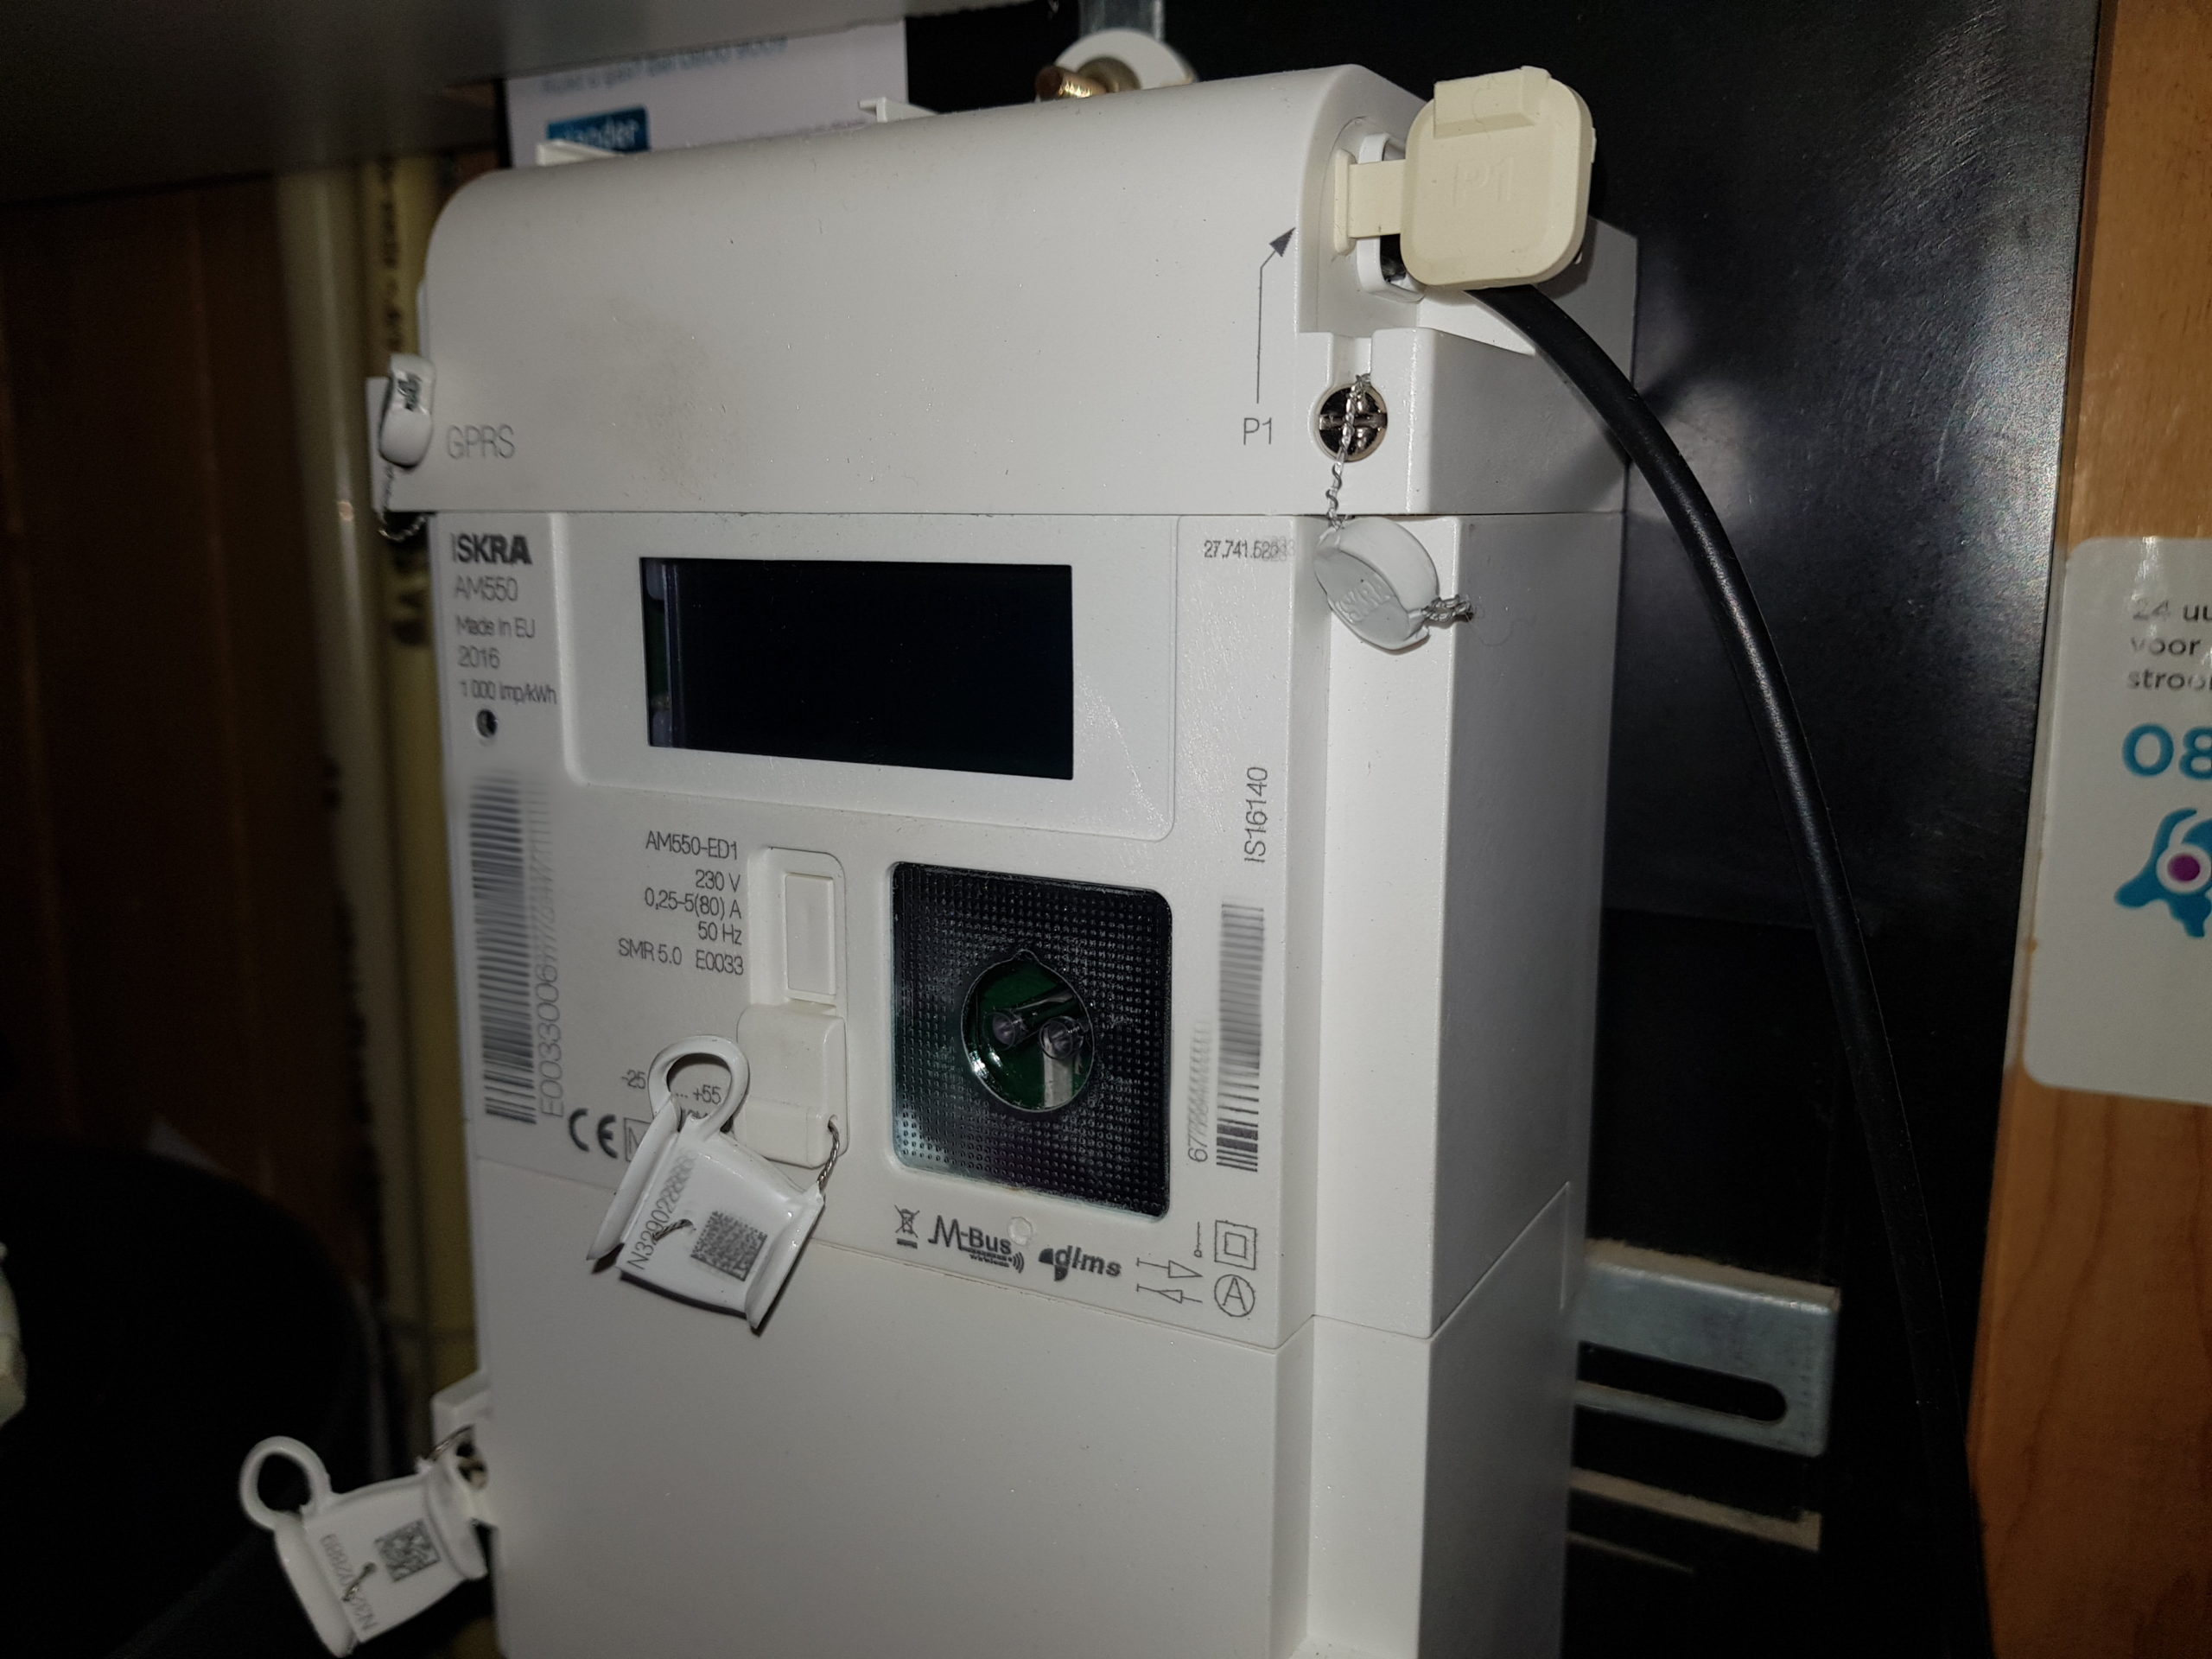
So back in 2018, I searched the internet for info on how to read this data. I found different examples and approaches. I actually did build my own ESP8266 WiFi enabled micro controller version to read the meter also. But as I already had a small linux server near the meter, I went for a simple serial to USB cable, and connected it to the linux server. Some python examples further, I wrote my own version of the script, installed it natively on the linux box, and started measuring the data. And that was sort of it… I did not add a nice graph engine, that was for a later date 😉
Fast forward two years later; 2020. Still no graph engine (you know how that works with hobby projects), but storing measurements for two years already. However by this time my small linux server starts to freeze / lock-up every so often. My guess is temperature issues, combined with old age.
As I needed some NAS disk storage, I found myself a NAS which is capable of running docker containers. Quite nice! A Synology DS918+. Having docker image capability allows me to move my stuff from the small linux server into the NAS.
One of the things to move was this energy meter measurement script.
Plan of attack
The migration plan (all using ssh command line, no NAS gui used):
- install mysql in a container.
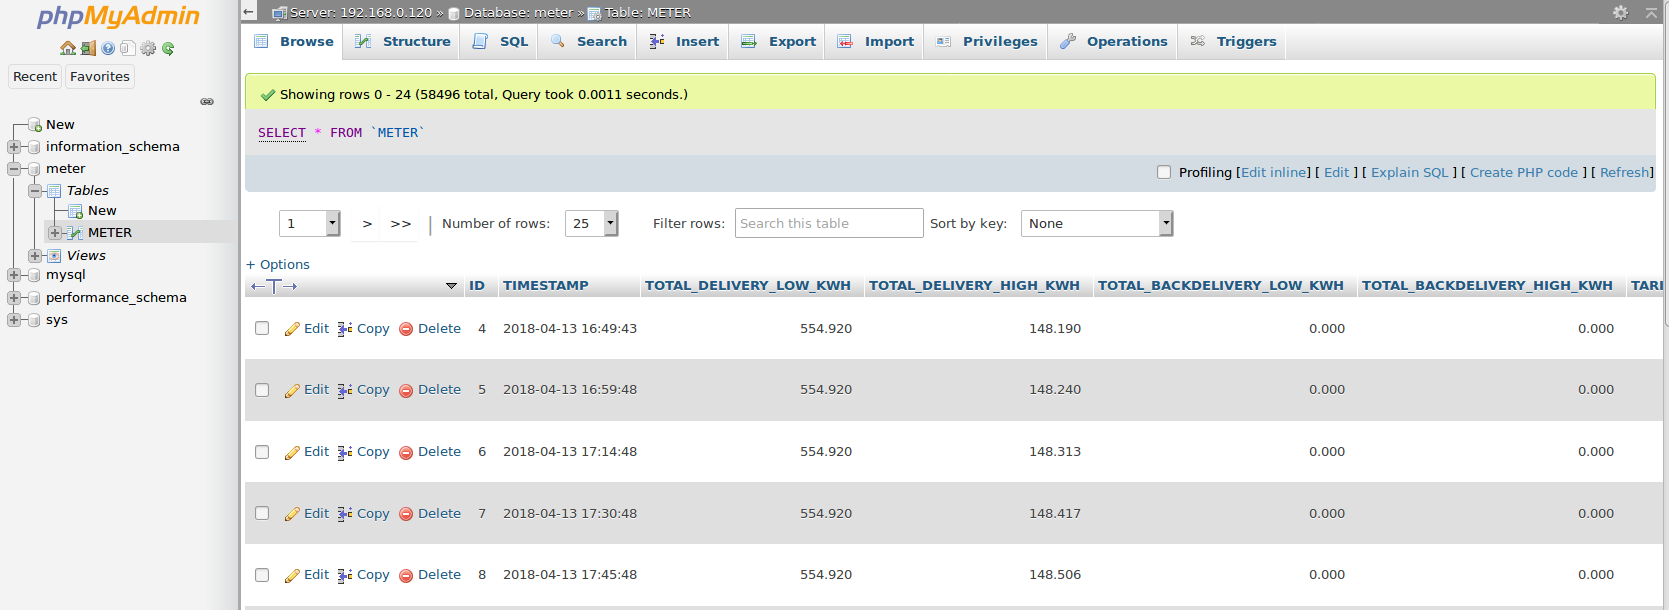
- install phpmyadmin in a container (sql web gui).
- install python, a cron-daemon, and the script in a container.
- connect the serial to usb converter cable.
- glue everything together, and get it to work.
Changes (October 30, 2020):
- add code in read.py to write data to influxdb.
- using an existing influxdb container on my server, so not described here how to install influx.
Changes (November 1, 2020):
- made new Grafana graphs, using the influx data. See github readme on tips for how to do that.
- wrote down in the readme how you can change the script to run every minute for influx, and keep storing sql data only every 15 minutes. I do like the more detailed 1 minute interval influx graphs better than the rough 15 minute graphs.
Issues (challenges)
- mysql seemed to use an authentication module, not supported by the python client library.
- my python script needed a library which is no longer in the ubuntu repository.
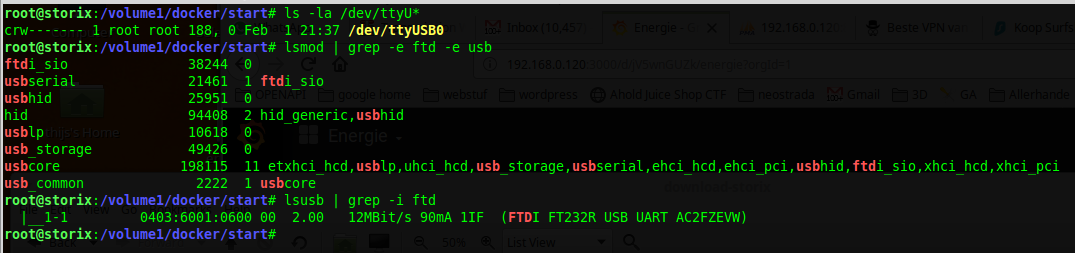
- my NAS needed some convincing to use the serial to usb converter.
Issue one was fixed by altering the password encryption module for the user which is used by the python script.
Issue two was fixed by using “pip install” instead of “apt-get install”. But… for later on the plan, I will have to upgrade the script from python 2 to python 3! Some deprecation warnings do show during the build.
Issue three was solved by loading some additional kernel modules in the NAS.
Installation Steps
Just have a look at the README.txt file in the git project… It’s quite extensive, and you need a copy of the code and files anyway.
In summary; edit the files to match your setup. Put the IP number of your docker server in some of the files, and update the database password if you like (not really needed if it’s not accessible from the internet). Same for influxdb, configure proper connection details for that. And you can choose between one or both of influxdb and sql storage. Make sure the serial port is on /dev/ttyUSB0, or edit some files to have the correct device in there. Build and start all containers.

Encore / Bonus
So… I did not have any graphing module at this time. It’s always some work to make a custom script/page for that, so that’s why it wasn’t done yet. However, why make your own? In the last years, at the office we started using Grafana. It’s a great tool for making dashboards with graphs on it!
And this did not cost more than a couple of minutes to get up and running, including the graph. Although in a crude first version. Probably fine for the next two years 😉
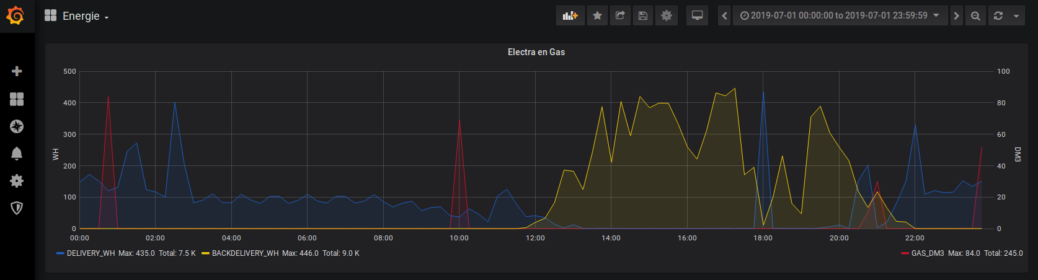
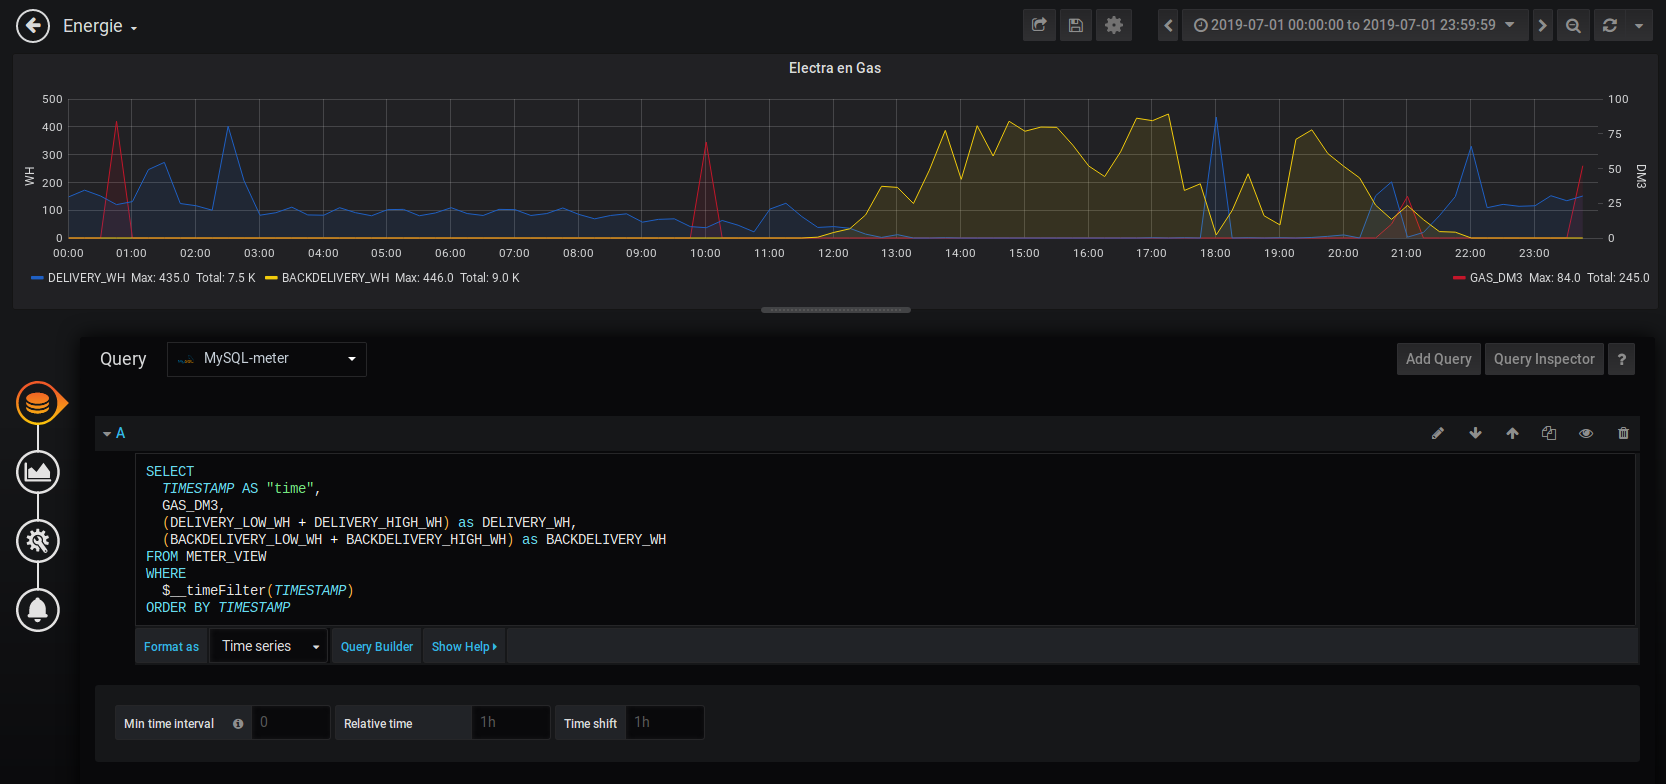
The steps were easy, see the README.txt again, at the bottom. In summary; create a docker volume to make sure the data is kept between restarts. Run a Grafana docker image connected to that volume. In Grafana, set up a datasource, connecting to the mysql database. And finally create the graph on a new dashboard. An example sql query is in the README.txt (warning: the screenprint below is missing the 4* factor in the values to get to hourly rates).
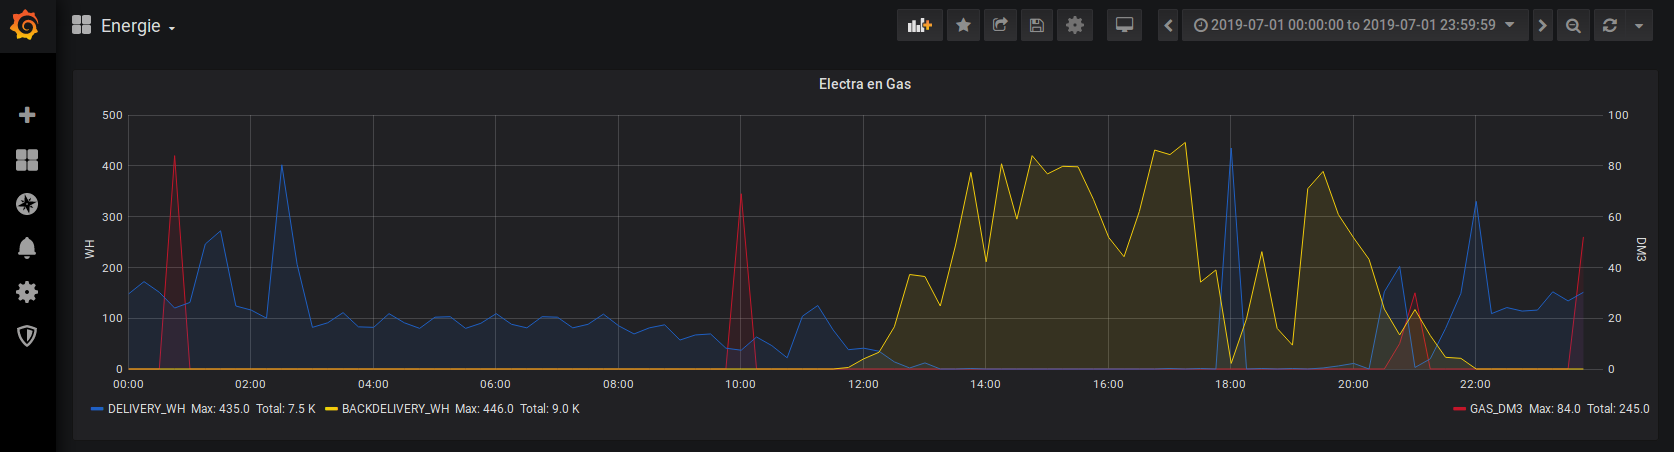
And here’s my first attempt at Grafana graphs, using the influx data. I switched from measuring every 15 minutes to measuring every minute around 15:40 at the right of the graphs.
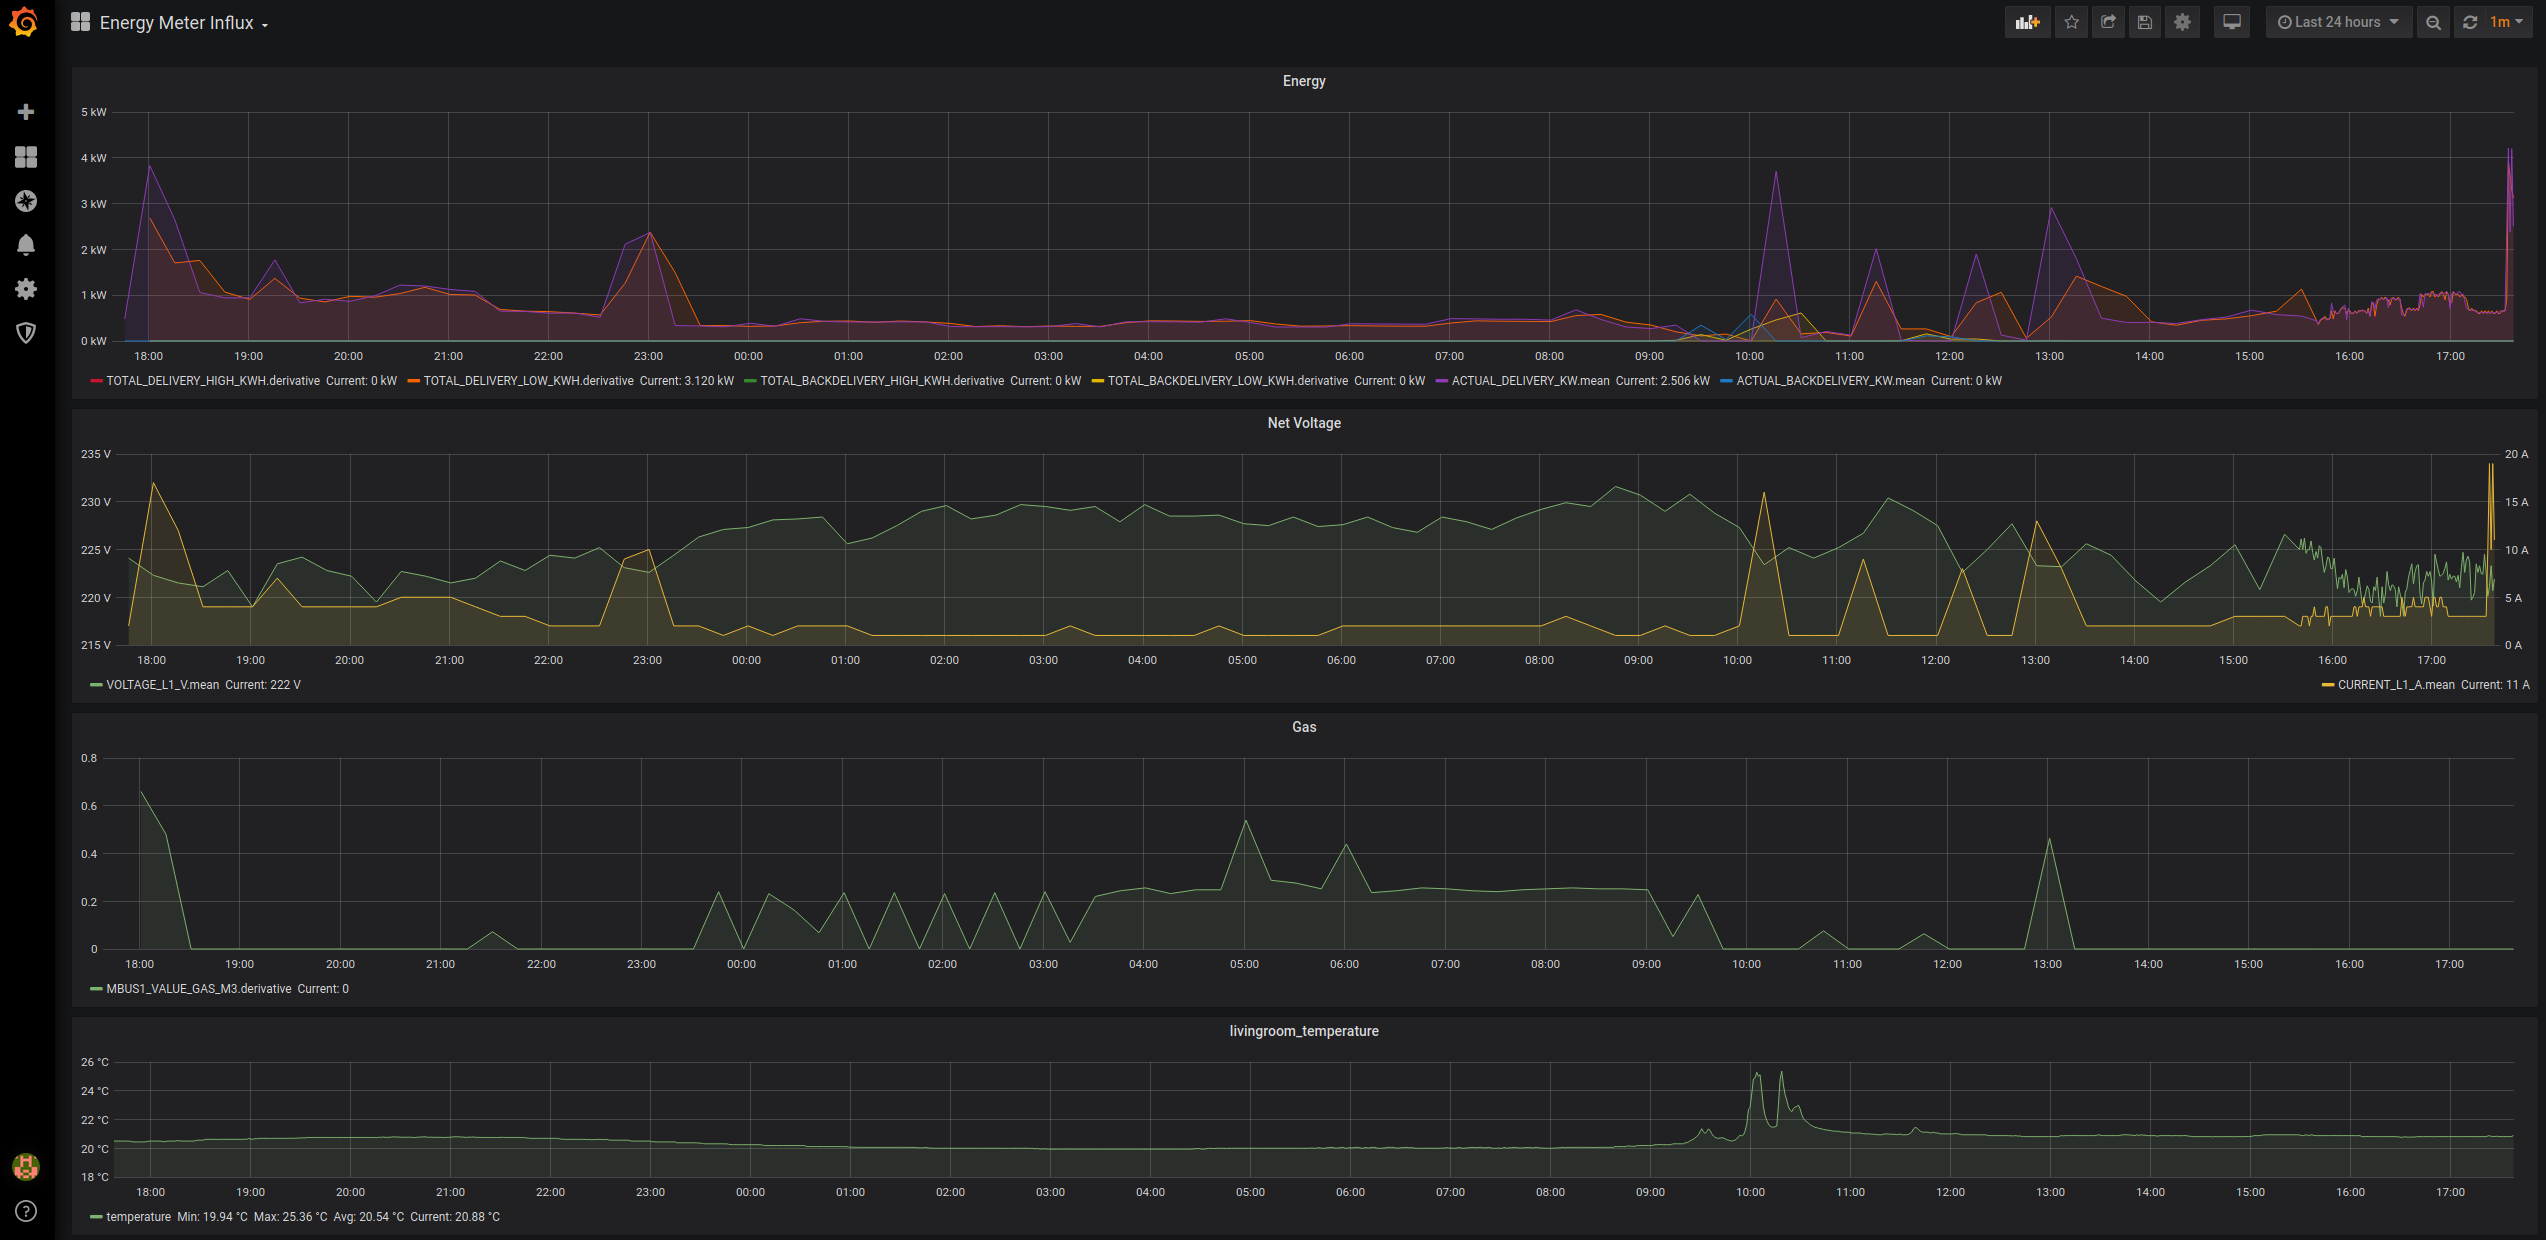
The influx graphs do render very quick, much better than using the SQL meter_view graphs!
Some notes on the python script
It’s quite a while ago that I wrote the script, but there are many code comments in it. So just have a good read of it, in case it doesn’t fit your situation. Should be easy to change / fix / update.
Here some notes:
- At the top, all connection settings to sql and influx databases can be set.
- Then the script opens the serial port, and connects to the database.
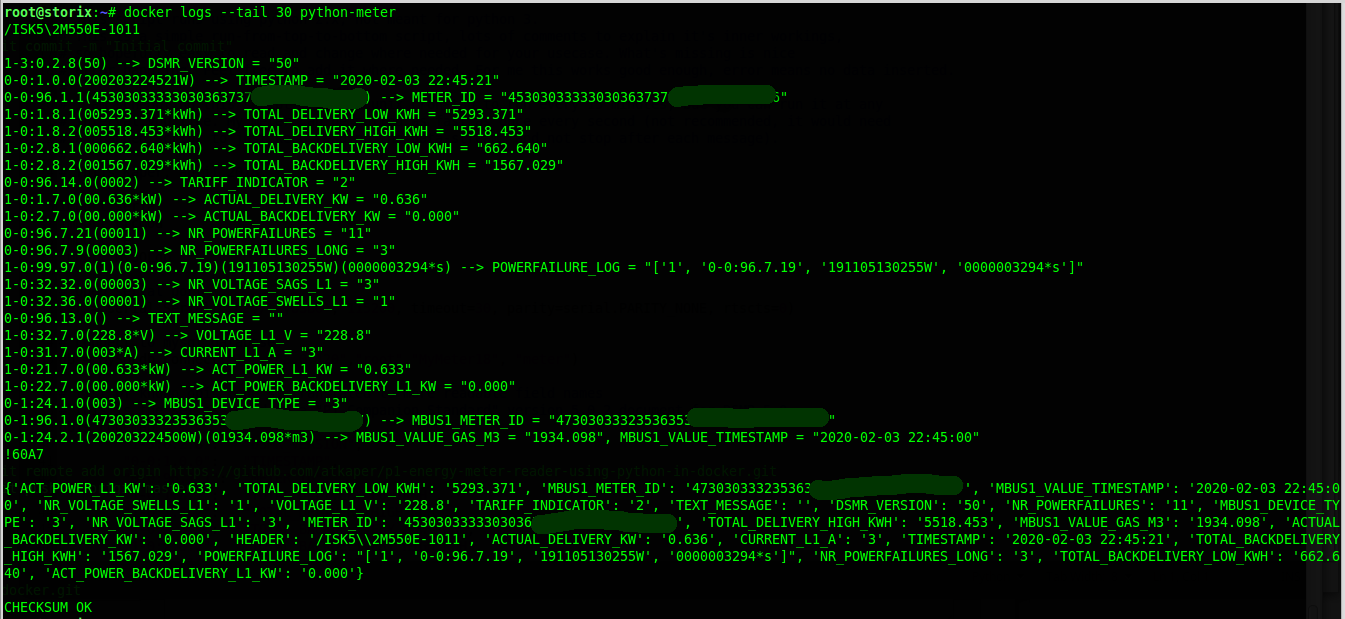
- There is a big map “obis_codemap”, which translates the codes at the start of the serial output lines into a human readable attribute label. It does follow standard version 5.0.2. for DSMR 5.0. And is taken from a manual, so should be fine.
- Then there is a helper function “parse_value”. It transforms some of the values into usable versions for sql.
- The code will look for a proper start line, and when found will switch to reading the lines one by one and use obis_codemap to map to usable data. Each data line is split on the round brackets in separate fields.
- The meter has an internal expansion bus (MBUS). In my meter, there is a (wireless) link with the GAS meter. In other cases you could have some other extra connections. You may need to tweak lines 139-146 for your situation.
- Lines 182-189 handle different cases of number of fields and data sizes, also depending on partial field names.
- 168-175 are used for the MBUS extensions, to memorize the type number. The serial data (called a datagram) is read top to bottom, and the MBUS#_DEVICE_TYPE value will determine the meaning of the data lines that follow.
- 197-200, printing the data line. Format: original input, followed by –> and parsed data.
- 204-209, look for end of message, and keep track of total message to use later for CRC checksum calculation.
- 217-228, checksum handling. On error exit without storing measurement.
- 231-272, insert data in influx (if enabled)
- 275-284, insert data in sql database, and close (if enabled)
To send data to influx, the key/value pairs from the meter are transformed in a post body with “KEY value=VALUE” lines. Where VALUE will be quoted if it is a string value. See notes in read.py for more info.
Conclusion
Back in 2018, it was a nice project to find out how to read the P1 meter port. You can find many ways to do it on the internet. Lots of data available.
Migration from native python into docker was not a big thing. Of course I took some shortcuts. You can make the container smaller, less build layers, and use internal docker networks instead of using the host IP and external port mappings. But this was just a hobby thing. Not an enterprise solution.
Nice bonus was the easy / quick addition of the graph using Grafana.
To get better graphing performance, it would be good to look at using InfluxDB instead of (or next to) mysql. Influx is meant for storing time-series data, and fast querying of it. Perhaps some other time… Done! (October 2020).
Thijs Kaper, February 3, 2020.
Note: the cable I used can be found on aliexpress; search for “Usb uart ttl to rj12 6p4c for ISKRA AM550 sagemcom XS210 meter in combination with Domoticz“, and I used the “ISKRA AM550” version of it. Here’s a link (not sure if it will keep working): LINK
5 thoughts on “P1 Energy Meter Reader using Python in Docker”
Hello,
I wanted to ask which cable you took exactly for reading the Iskra AM550 electricity meter.
Best regards!
Updated the article with a note to point to the used cable, and it’s search terms in case the link won’t work anymore later on.
Thank you!!1
Nice.
Nice, will give it a try soon.