Fluent Bit Elastic Search Data Type Filter
Summary
I have created a Fluent Bit LUA Filter to force proper data types to be send to our Elastic Search (log collector) Database, to prevent Elastic from rejecting the log records.
GitHub Project: https://github.com/atkaper/fluent-bit-lua-filter-elastic-data-types
Environment
We are running a bunch of (on premise) Kubernetes clusters, all having around 20 nodes, with many deployments on it.
The deployments use different technologies; Java, Kotlin, Node.js, GO, Python, C, … and quite some standard open source applications. Most of them have been configured to log in JSON format, but… they do not conform to some standard for field naming and values in use. That’s quite impossible due to the many technologies and many developers working on this (over 100 people).
The Problem
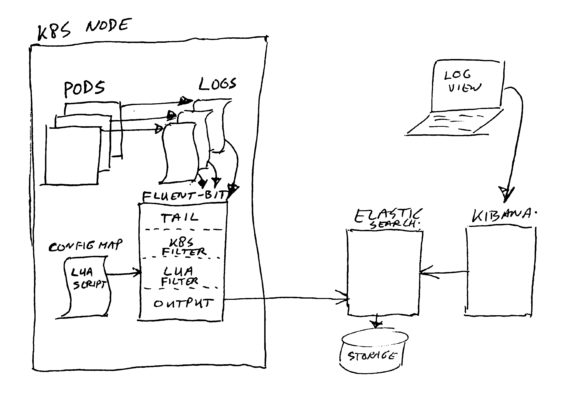
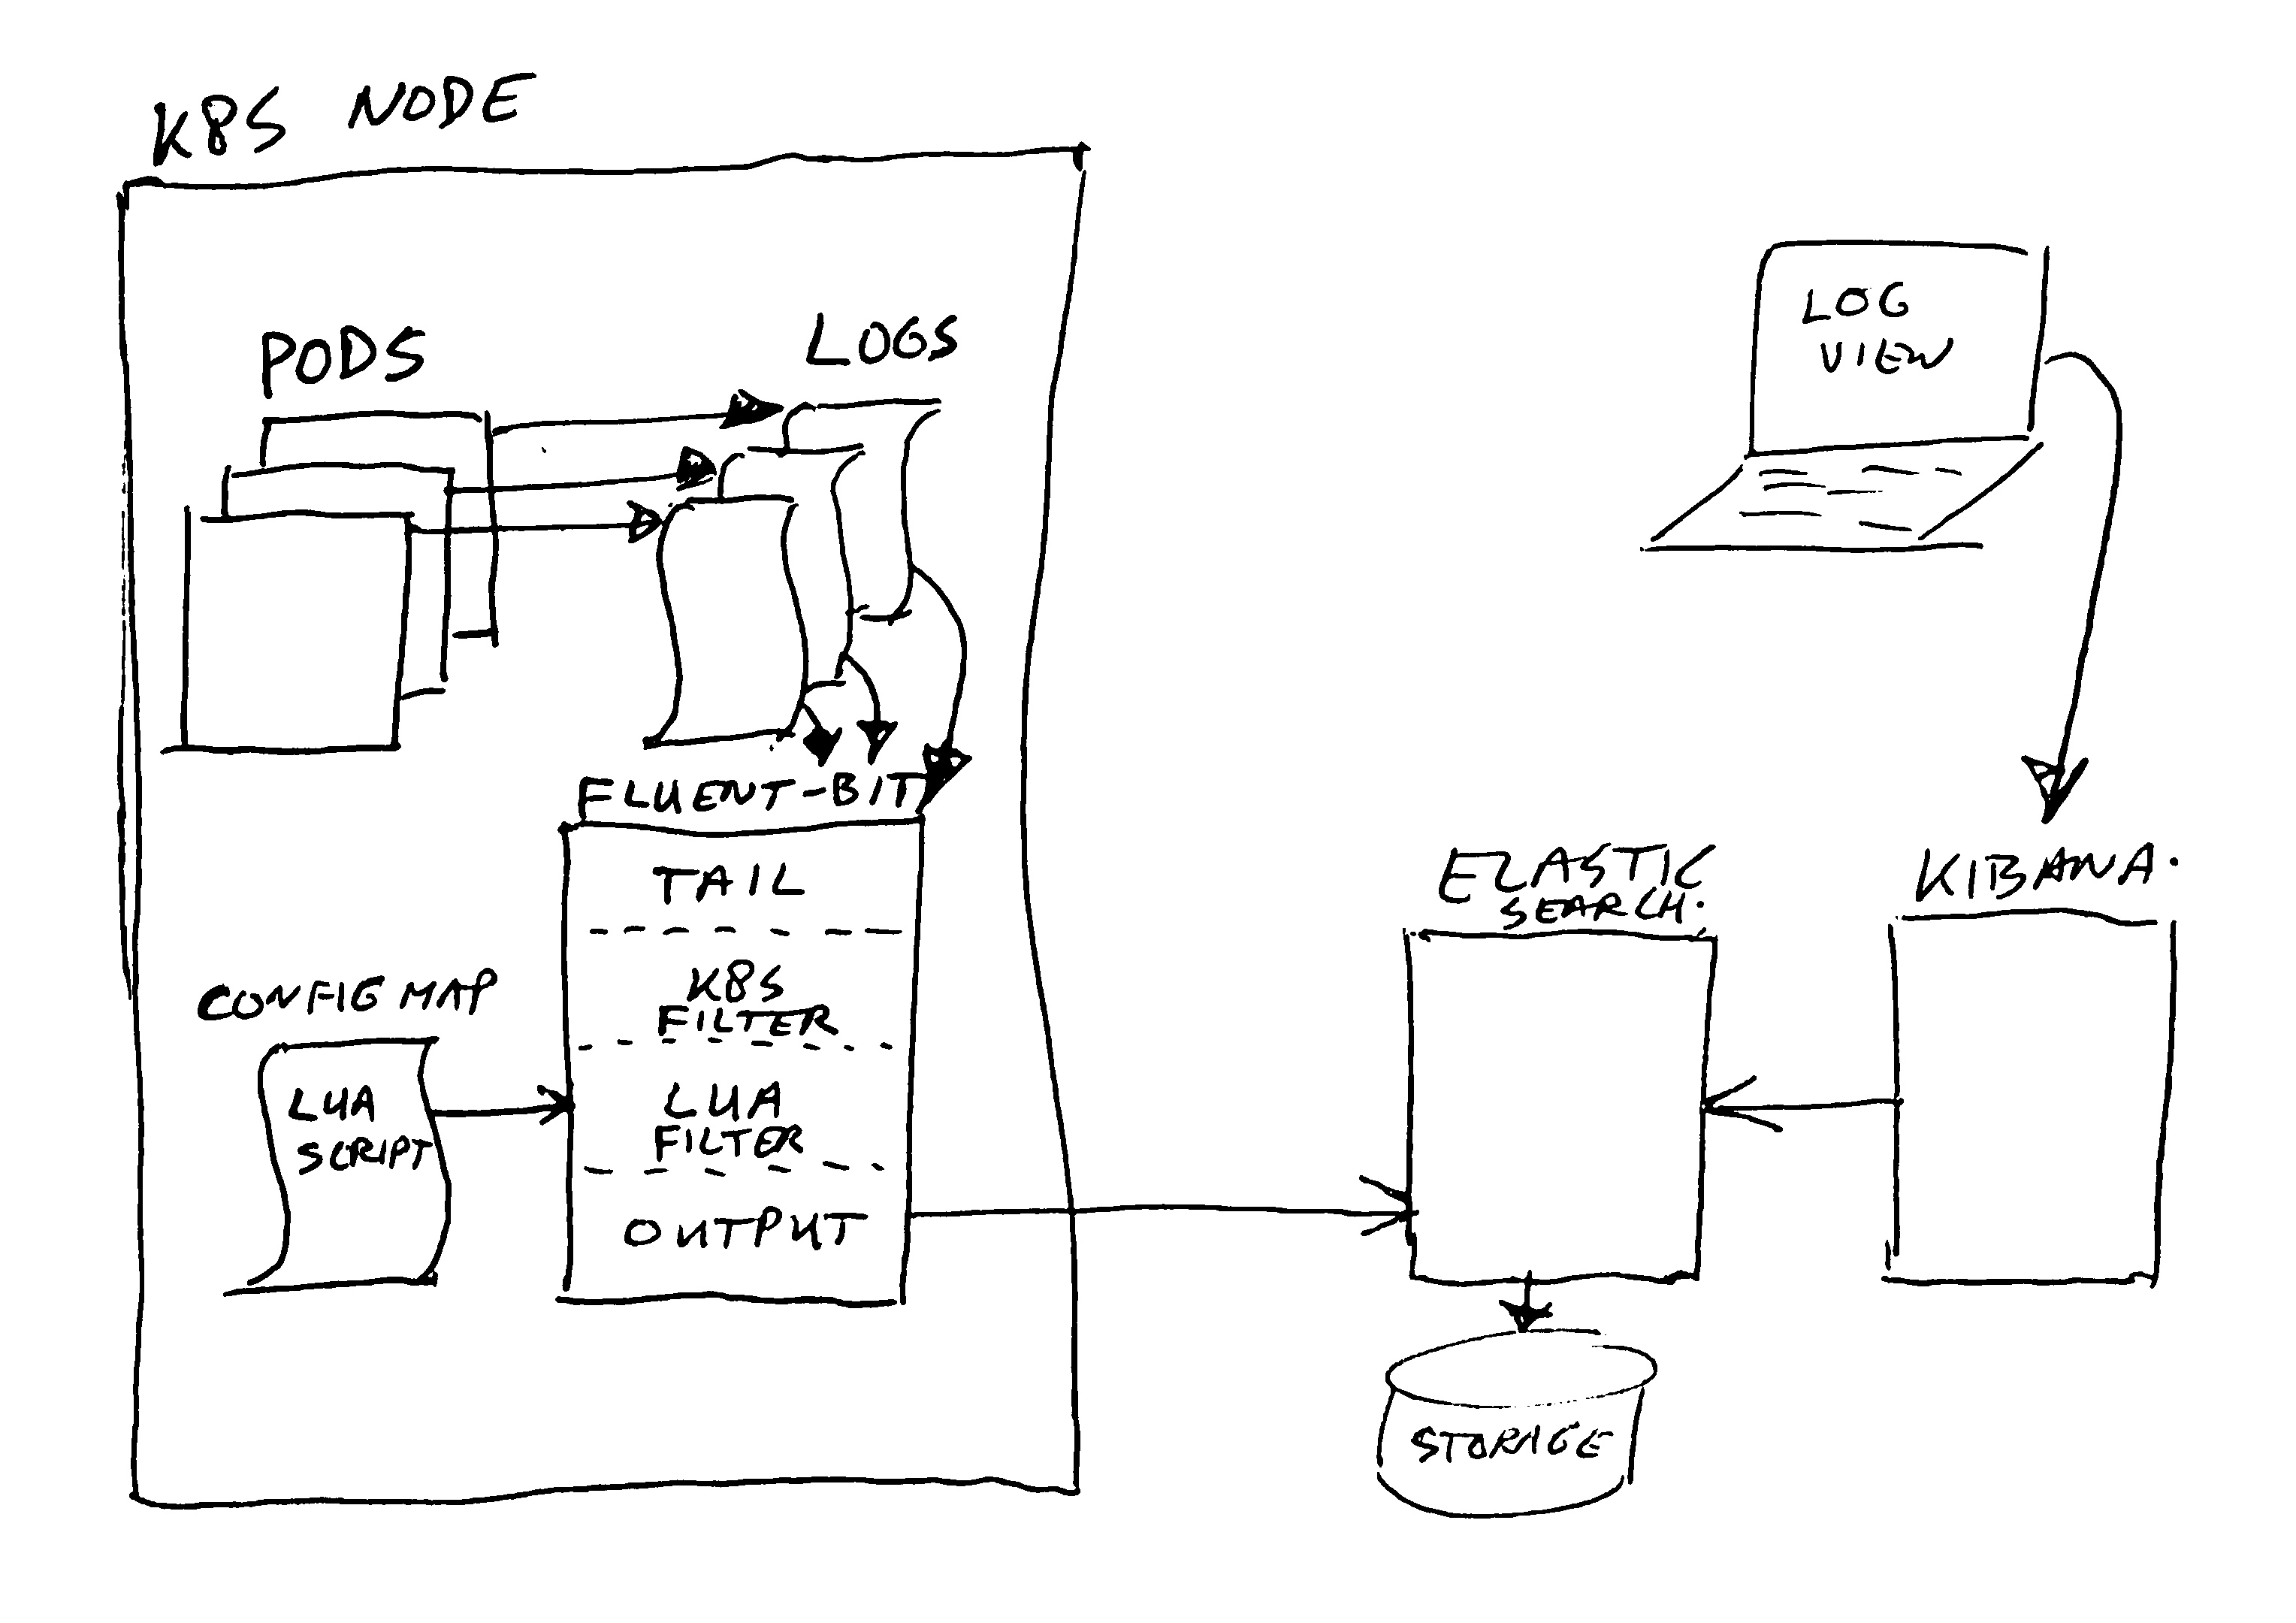
We use fluent-bit to send the logs to Elastic Search, for display in Kibana. However, Elastic Search is quite picky about the data types you try to send it.
The first received definition of a field determines the data type for it (makes it fixed). If you send it a new log record, using a same field name but having a different data type, then Elastic will reject the log record! Yuck…
You can recognize this situation from error snippets like these in your fluent-bit log:
... "status":400,"error":{"type":"mapper_parsing_exception","reason":"failed to parse field [response] of type [text]","caused_by":{"type":"illegal_state_exception","reason":"Can't get text on a START_OBJECT at 1:5604"}}}} ...Code language: JavaScript (javascript)The fluent-bit log is not very helpful in finding out which log record of what deployment is the delinquent which is trying to log in a wrong data format. This is probably caused by the fact that fluent-bit sends the data using bulk transfers in big blocks.
A Solution
So what can we do to fix this?
Of course you could investigate all log files, come up with a standard set of field names and data types, and ask all developers to try and conform to that.
But… I do not see that as an option. There’s too many applications. Too many logs. Too many developers. And also we do run applications not build by us, which are not that easy to get in the right log format. And I am of the strong opinion that NOBODY should be able to (accidentally) break our log system! It must be robust and fault tolerant, and keep logging!
My simple solution is to just force all logs into a proper data format before sending it to Elastic. Note: it’s not a perfect solution, if you want, you can break it still quite easily. But I’ll leave that up to your imagination on how that can be accomplished. Let sleeping dogs lie. 😉
I did check our Elastic Search indexes for the current active data types, and created a list of the non-string ones. Actually mainly the ones which need to be numeric.
The filter will check each log field to see if it matches the data type in our list. If it matches, it will leave it as is.
If it does not match, it will either just force/cast the value to a string value, or in case of a required numeric field it will try to parse it to a number. And in some cases the filter will also rename the field, either post-fixed with “_str” or “_obj” if the required destination field type expected a number, table, or Boolean value.
The filter will also “flatten” any nested JSON entries into a single string value. The result will contain nested field names, and their values. These flattened values end up in the “_obj” post-fixed fields. You can disable this flattening by specifying a field as (LUA) “table” data type. Note however that in that case we trust the nested data to always use proper/same data types for it’s nested field values. The filter will not check nested data. We use this exemption for the “Kubernetes” fluent-bit filter values.
The reason for flattening all nested fields is to keep the data type checking simple. And to prevent Elastic from having to index many many different field names. There is a limit to the number of fields which can be indexed. Some of our applications send the full HTTP request header and cookie set in the log as nested JSON, with the header and cookie names as field names. These header names and cookie names quite often do not have a limited set of names, but contain customer or other functional specific codes as part of the name. This causes many different field names to be generated.
Running The Filter
The filter script is in the file “filter-script.lua“. You should make it available in your fluent-bit process (container), and configure fluent-bit to call the cb_field_type_check function for all records to filter. See the fluentbit.io website / manual on how to configure this.
We use helm charts and values to deploy fluent-bit, and I had to modify these to add the option of adding LUA scripts. At this time it is not yet part of the standard / public helm chart for fluent-bit (too bad). My change added the script to the config map containing the fluent-bit config as a separate script file section. Perhaps some day I will create a pull-request to add this option in the public helm chart. For now, you are on your own to hack it in. Either build a docker image containing the script file, or add it in a config map and add it as file / volume mapping.
If you want to alter the filter script, and quickly “test” it standalone, you can use the “filter-script-test.sh” file. It assumes you have installed a standalone LUA interpreter. The test script does not require fluent-bit. It just creates a dummy test record, prints it out, passes it through the filter script, and prints the result values. It is not a “real” unit test in any way, it does not assert any correct functioning, it merely serves as a simple debug like runner. Feel free to send me a pull-request with a real test suite if you like.
Conclusion
We are running this filter now for approximately two weeks. The current fluent-bit version we run is 1.1.3, and (probably?) next week I will upgrade to 1.2 or higher.
The number of non-loggable-records went down drastically! Yay! It works! 😉
Before this, we were running fluent-bit 1.0.x, and it kept stopping to tail the logs after a certain number of Elastic errors. We had to setup a cronjob to kill / restart all fluent-bit instances every two hours, to pickup logging where it left of.
I have stopped this cronjob, but I still have to double check that the system does not stop logging anymore. Hopefully this filter, together with some of the fixes in the new fluent-bit versions will keep it running now.
At this time we still do see quite a number of log issues. Mainly with UTF-8 errors, and some other (non data type) ones, which I still have to investigate. But perhaps the new fluent-bit version has some more fixes for this already. I did see something in the 1.2 change-log about fixed UTF-8 issues.
Note for the performance concerned users; LUA script is handled by an interpreter, but LUA has been designed for high performance use cases like these. So no worries. I did not see a huge increase in CPU load after adding this script.
Thijs.
One thought on “Fluent Bit Elastic Search Data Type Filter”
Worked with Thijs at this same project. Great solution for a long-running problem that we had encountered. Never thought a making a Lua script to do this. Good job!